Coronavirus Deaths 60% Higher Than Official Numbers
The FT used a fairly straightforward methodology: the paper took data on national death tolls over a certain stretch of time going back five years, calculated the mean for each country, then compared that figure to the number of deaths reported during the same time period in 2020.
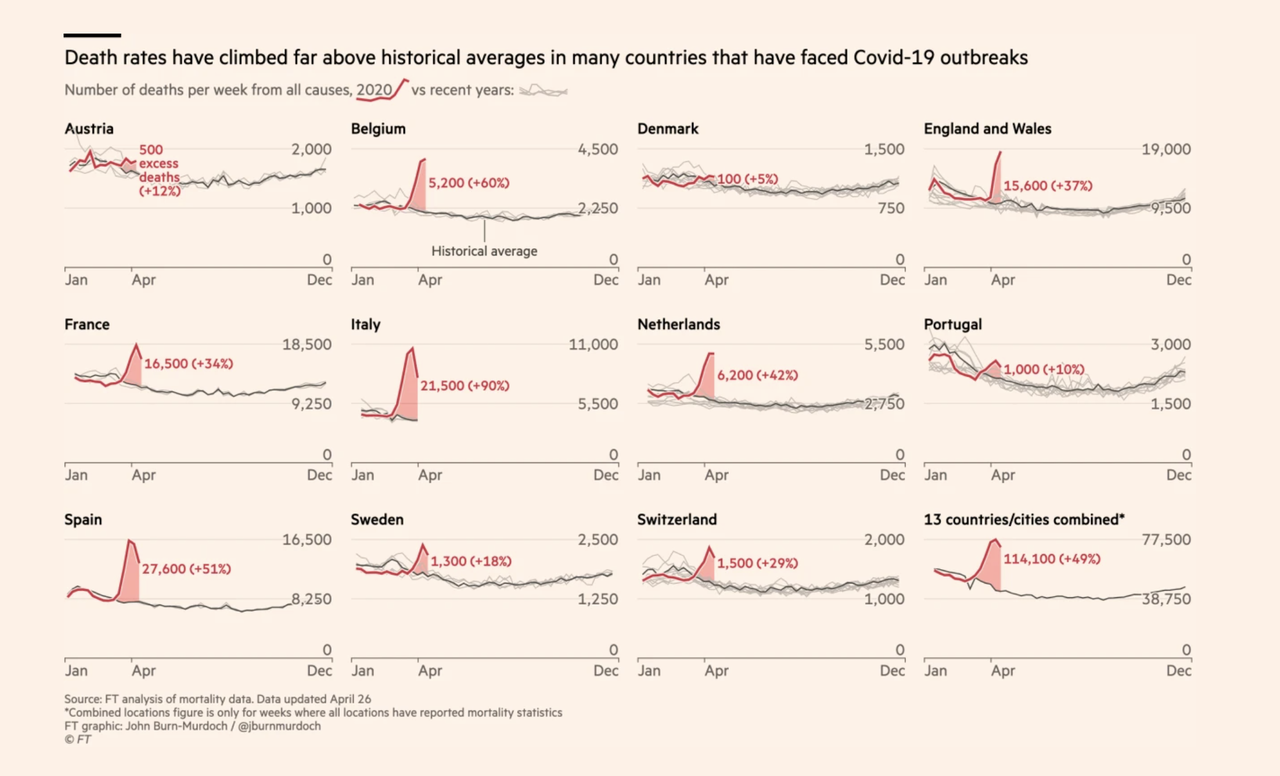
To calculate excess deaths, the FT has compared deaths from all causes in the weeks of a location’s outbreak in March and April 2020 to the average for the same period between 2015 and 2019. The total of 122,000 amounts to a 50 per cent rise in overall mortality relative to the historical average for the locations studied.
The difference between the average from the past five years and the 2020 number is, roughly, the number of deaths caused by the coronavirus (by far the biggest differentiating factor). Across countries in the developed world, the FT found 122,000 deaths ‘in excess’ of normal levels. That’s compared with ~77k reported coronavirus deaths. If the FT’s methodolgy checks out, that would mean coronavirus deaths have been 60% higher than official statics reflect – at least in the developed world.
The death toll from coronavirus may be almost 60 per cent higher than reported in official counts, according to an FT analysis of overall fatalities during the pandemic in 14 countries. Mortality statistics show 122,000 deaths in excess of normal levels across these locations, considerably higher than the 77,000 official Covid-19 deaths reported for the same places and time periods. If the same level of underreporting observed in these countries was happening worldwide, the global Covid-19 death toll would rise from the current official total of 201,000 to as high as 318,000.
The only country that showed almost now deviation between ‘excess deaths’ and the number of confirmed coronavirus cases was Denmark.
Source: FT
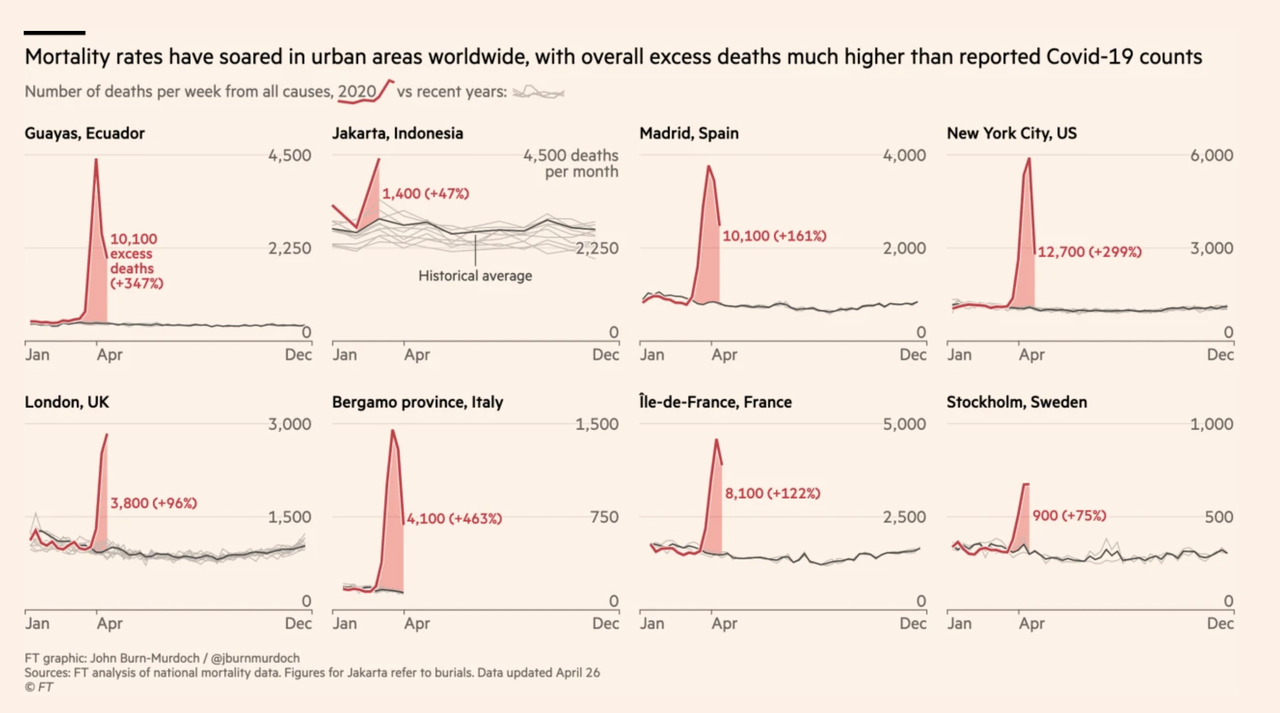
The gulf between the ‘official’ coronavirus death toll and the ‘excess mortality’ rate tabulated by the FT. was widest in the emerging world. In some places, the difference was ~100x (that’s 100x not 100%). Officials reported roughly 250 deaths due to the virus, but the number of ‘excess’ deaths was 10,200 in Ecuador’s Guayas Province.
In Ecuador’s Guayas province, just 245 official COVID-19-related deaths were reported between March 1 and April 15, but data on total deaths show that about 10,200 more people died during this period than in a typical year – an increase of 350 per cent.
If we assume that every single ‘excess’ case calculated by the FT is representative of a single case of COVID-19 (not exactly a scientific assumption, but fair enough for an estimate…), then we can compare which provinces, states and countries were most badly impacted. According to the FT, the region surrounding the Italian city of Bergamo suffered a much more severe outbreak than New York State.
In the northern Italian region of Lombardy, the heart of Europe’s worst outbreak, there are more than 13,000 excess deaths in the official statistics for the nearly 1,700 municipalities for which data is available. This is an uptick of 155 per cent on the historical average and far higher than the 4,348 reported Covid deaths in the region. The region surrounding the Italian city of Bergamo registered the worst increase internationally with a 464 per cent rise in deaths above normal levels, followed by New York City with a 200 per cent increase, and Madrid, Spain, with a 161 per cent increase.
The FT isn’t the only financial news organization to try and determine by how much some countries are underreporting cases and deaths linked to the novel coronavirus.
Source: FT
Bloomberg on Sunday reported that the number of severe respiratory infections reported in Mexico over the past two months, coinciding with the end of flu season, were up more than 50% compared with last year. Experts working for the Mexican government quietly told Bloomberg that the increase is likely 100% attributable to the virus.
Severe acute respiratory infections in Mexico spiked 50% this season compared with a year ago, almost certainly all due to coronavirus, suggesting that government figures on Covid-19 cases are far too low.
In the most recent week, health ministry data show, Mexico registered 12,000 new cases of such respiratory infections, versus 671 in the same period a year ago.
“Of course that jump in cases is Covid-19, because influenza is on its way out this time of year,” said Alejandro Macías, the former national commissioner for influenza in Mexico during the H1N1 outbreak. “There’s no doubt.”
To be sure, the FT doesn’t question the general trends displayed in global data – well, at least not in developed countries like the US and Italy. But it’s just the latest reminder that armchair experts claiming that the true mortality rate for the virus is actually a small fraction of a percent are likely also gravely underestimating the total number of deaths that have gone underreported.
This just means that the grainy videos released by brave Wuhanese during the early days of the outbreak remain the most reliable indicators of what the novel coronavirus is capable of if left unchecked.
Though they’ve been wiped from the Chinese Internet, millions around the world witnessed the videos of dead bodies of the elderly in the streets, hospital hallways packed with the doomed, pandemonium, chaos – and Party officials firing up the crematorium out back.